The Apollo Asia Fund's NAV rose 5.1% in the second quarter, to a new high of US$1,557.29: over the last twelve months it was up 27%.
At the end of June, our portfolio was on an estimated current-year PE of 13.3, with estimated current portfolio EPS up 21% from a year earlier.
There has been much recent discussion of Chinese statistics, but I have seen none at all on an interesting revision to BP's data on Malaysian oil production and consumption. BP's annual 'Statistical Review of World Energy' has become a principal source of information on primary energy trends: the latest version may be found at www.bp.com. The Energy Export Databrowser provides helpful charts based on this data.
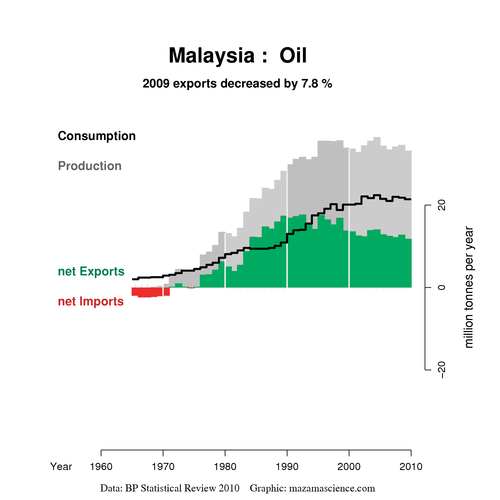
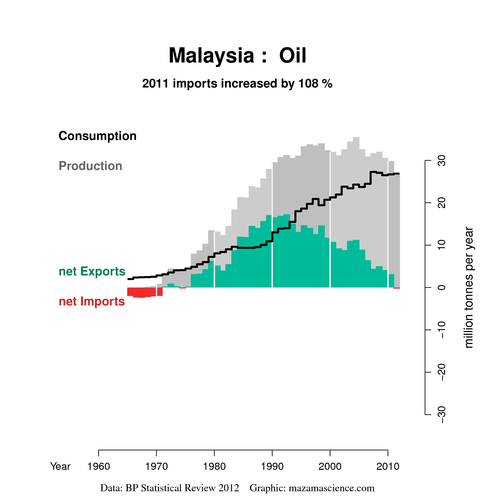
Compare the chart on the left, based on data in BP's 2010 review, with that on the right, based on its latest review:
|
|
The earlier chart shows Malaysia's oil production on a plateau since 1995, consumption levelling out since 2002, and a gradual reduction in net exports. The chart from the latest data shows a much more alarming picture: falling production, a continued rise in consumption, and a rapid collapse of net exports.
2011 was a poor year for Malaysian oil production, due partly to temporary factors. Bank Negara reported a 10.7% decline (v BP's 10.9%) and attributed it to 'shutdowns of several production facilities for maintenance purposes, declining production from mature fields, and lower-than-expected production from new fields'. The trends in recent years are comparable in the two sets of statistics. Unexplained are the major revisions to BP's historic data series. Over the last two years, BP has revised downward the production figures back to 1984, but particularly since 1995; and revised upwards the consumption figures since 1994, but by escalating amounts since 2000, particularly since 2006. Unfortunately, 'BP regrets it is unable to deal with enquiries about the data', and we cannot find current consumption figures in any Malaysian source. While searching unsuccessfully for explanations, we compiled this spreadsheet summarising the various different Malaysian data sets, where to find them, and the differences between them.
 |
 |
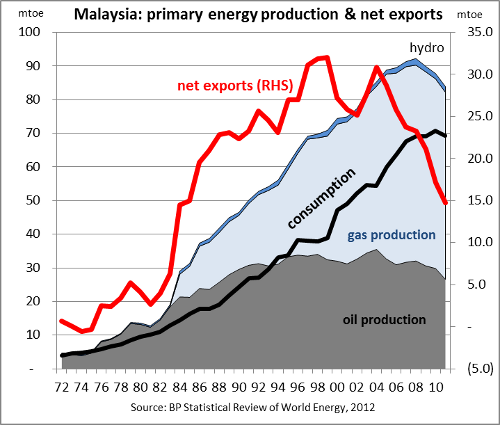
Malaysia's decades of prosperity have coincided with a great energy windfall. When oil production ceased to grow, gas production continued to soar - but that has now ceased. The chart on the left suggests the magnitude of the changes which may now be under way. It is based on the latest BP review, and includes figures for hydropower (small) and biofuels (insignificant). According to BP, Malaysia's primary energy production, in million tonnes oil equivalent, peaked in 2008: three years later, it was down 9%. Malaysia's primary energy consumption continued to rise until 2010 - but in 2011, gas shortages began to bite in the Peninsula; BP shows domestic gas consumption down 10.5% for the year. Net primary energy exports peaked in 1999; they are since down 54%
Without BP's recent data revisions, the decline in net exports would be less steep, but still significant. The issue is surely of huge importance to the economy, the government budget, and the patronage machine. One would expect such issues to feature prominently in public debate, but there is little awareness or discussion. To some extent, growing demand reflects an attempt to add value locally rather than exporting raw commodities - but is this always a wise use of a dwindling resource? There are some moves to phase out energy subsidies by gradual increases in gas prices to industrial users, but no apparent Plan B for what happens if the market price continues to outpace the planned increases. Fuel and electricity prices are politically sensitive, so no rational discussion occurs, and profligacy continues. Meanwhile, moves to encourage development of Malaysia's marginal fields seem sensible, but are they likely to stem the decline?
| Geographical
breakdown by listing; 30 Jun 12 |
% of
assets |
| Hong Kong | 13 |
| Japan | 16 |
| Malaysia | 17 |
| Singapore | 30 |
| Thailand | 15 |
| Other | 2 |
| Net cash & receivables | 7 |
100 |
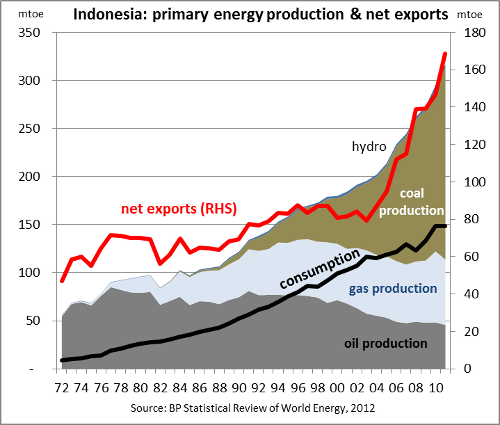
Indonesia became a net importer of oil several years ago, and its oil-and-gas production peaked in 1997, but the remarkable growth in coal output has led to a continued rise in primary energy output and net exports (right hand chart above). While the coal mining sector has received plenty of attention from investors, it is interesting that the decline in primary energy exports from 1996 to 2003 coincided with a period of very poor performance for the Indonesian stock market, and the subsequent surge in primary energy exports has coincided with the prolonged boom.
Energy policy in Indonesia is certainly no more coherent than in Malaysia, but the musings of ministers do at least range more broadly, which may perhaps allow hope for change. Indonesia, Malaysia and India suffer from the distortions and misallocations caused by energy subsidies: reforming these would be a good place to start.
While we consider energy issues extremely important for the next few decades, the timescale on which they play out can be awkward for investors. We added only one new name to the portfolio in the second quarter, and that had no relation to energy; we trimmed and added, but made no dramatic changes. Japan still seems to offer unusual value, and our allocation there has increased slightly.
Claire Barnes, 16 July 2012
Postscript 18 July:
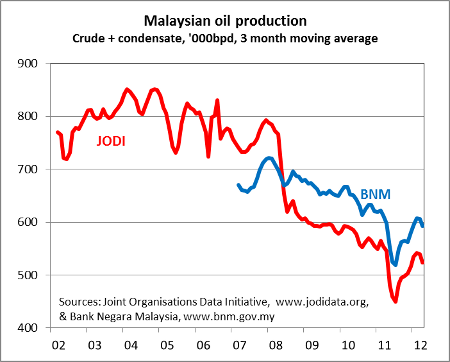
The spreadsheet has been expanded with data from the US Energy Information Administration (EIA, www.eia.gov) and from the Joint Organisations Data Initiative (JODI), which broadly agree with the current BP picture of a rapid decline in Malaysia's oil production. JODI and Bank Negara both give monthly statistics, and JODI's show a much steeper decline (right).
BP's consumption figures are for a broader range of products than its production figures. Its world oil consumption figures exceed its production figures by a growing margin, as shown in this blog post. Nevertheless, the revisions to production and consumption for Malaysia are unusually large, and remain unexplained. One guess is that a shift from net exports to net imports is more visible to the market than a mere change in net export level, and that the statisticians then have to reconcile their historic figures with the new facts while avoiding the assumption of too drastic a change in one year. While statistical details remain unclear, this affects only timing. The long view already provides cause for concern, but this may be playing out faster than expected.
| Home | Investment philosophy | Fund performance | Reports & articles | *What's new?* |
| Why Apollo? | Who's Claire Barnes? | Fund structure | Poetry & doggerel | Contacts |